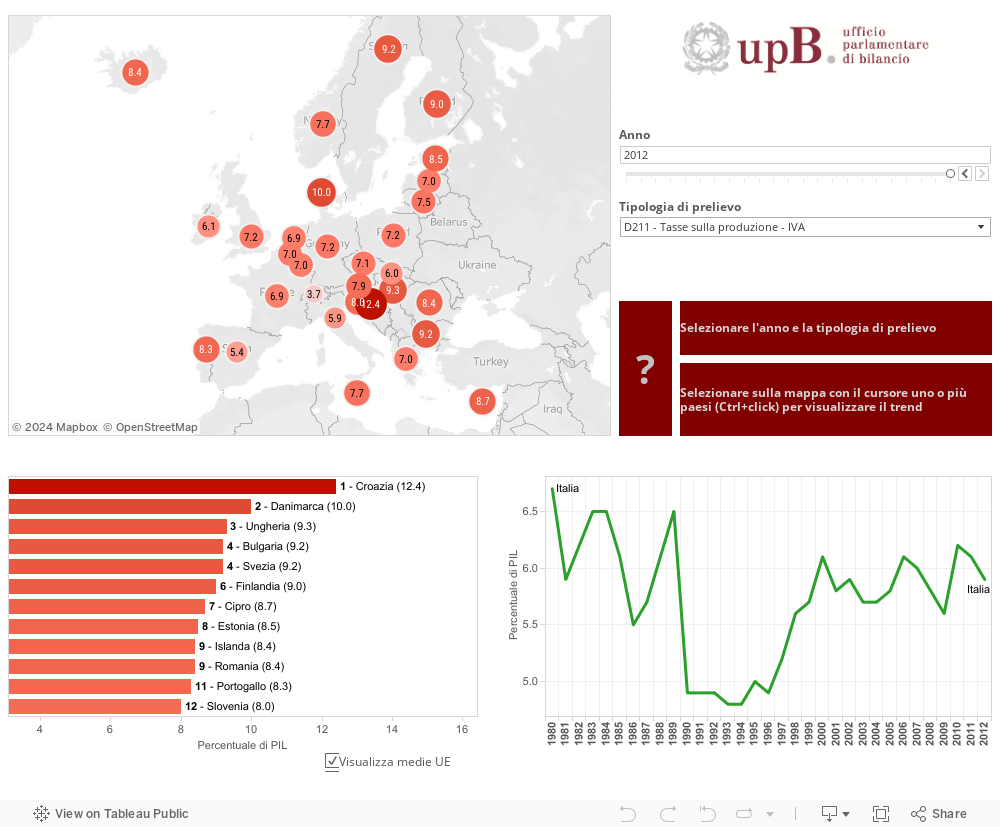
Interactive map of tax revenue by type of levy in Europe
Geographical distribution of tax revenue by type of levy as a percentage of GDP for the main European countries (1990-2012).
The chart can be downloaded by clicking on the download icon  at the bottom of the page.