Beginning in 2010, general government primary expenditure – i.e. expenditure net of interest spending ‑ contributed significantly to the consolidation of the public finances, with the involvement, albeit to differing extents, of all the sectors of government. The Focus Paper demonstrates how the contribution of central and local government to containing expenditure only partially offset the growth in social security spending, mainly influenced by demographic trends and a number of measures adopted during the period. This was particularly the case with the reduction in investment spending.
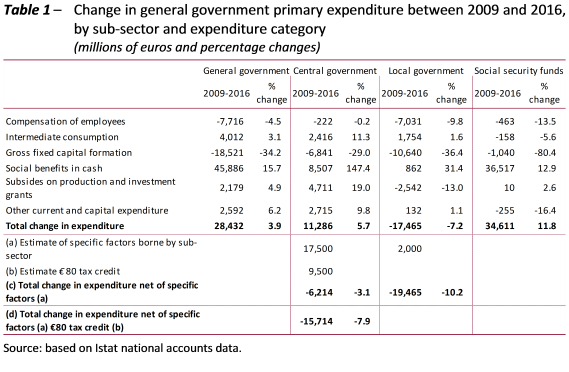
Two phases can be identified in the developments in nominal spending during the fifteen years from 2001 to 2016: an initial phase of uninterrupted growth until 2009 (an average annual increase of 4 per cent) following by substantial stabilisation (an increase of 0.5 per cent) over the subsequent years. In real terms, this corresponds to an average annual increase of 1.5 per cent in the first sub-period and a 0.5 per cent contraction in the second. Between 2009 and 2016, primary expenditure increased by a total of €28.4 billion in nominal terms (+3.9 per cent). Excluding expenditure on social benefits in cash, primary outlays fell by €17.5 billion in nominal terms (-3.9 per cent). In the same period, the social benefits in cash increased by €45.9 billion (+15.7 per cent), reflecting demographic developments, automatic indexing mechanisms, new income support measures (the €80 tax credit) and unemployment programmes.
All general government sectors shared the commitment to curb spending: between 2009 and 2016, the primary expenditure of central and local government, taking account of certain specific factors (such as changes in the scope of sectors) that affect the interpretation of the data, contracted by about 3 and 10 per cent, respectively (Table 1, row (c)), while spending by social security funds grew, but at a significantly slower pace than the previous decade (+11.8 per cent between 2009 and 2016, compared with +42.5 per cent in the previous period). Excluding the €80 tax credit (which is treated as a reduction in the fiscal burden in many studies and in the national accounts is classified as a State sector social benefit), primary expenditure by central government decreases by about 8 per cent (Table 1, row (d)).
In line with these trends, half of the change in annual average expenditure over the entire fifteen-year period (2.4 per cent) is attributable to social security funds, with central and local government contributing equally to the remainder (0.6 and 0.5 per cent). An analysis of expenditure by category shows that the most substantial decreases came in gross fixed capital formation and compensation of employees, which in 2016 were lower in absolute value than in 2009 in all three sub-sectors, with especially large reductions in local government (Table 1). The annual rate of growth in compensation of employees reversed course, going from an average of 3.4 per cent between 2002 and 2009 to one of -0.6 per cent in 2010-2016, reflecting a range of cost-cutting measures ‑ a freeze on contract renewals and seniority wage increases, restrictions on turnover ‑ in place since the end of the last decade.
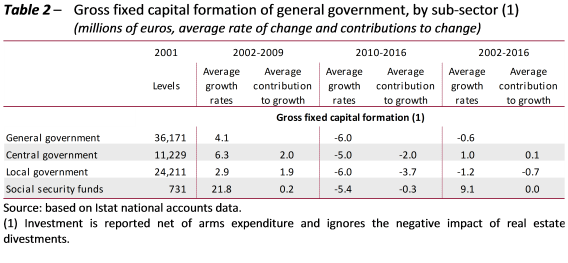
Focusing on gross fixed capital formation (excluding arms expenditure and ignoring the negative impact of real estate divestments), the average annual growth rate for general government swings from +4.1. per cent in the 2002-2009 sub-period to -6 per cent in 2010-2016 (Table 2). The figure for 2016 is much lower than that recorded in 2001: to find a similar amount we have to go even further back in time, to 1998. This trend confirms that a major part of the adjustment of the public accounts is attributable to not carrying out investments, the easiest expenditure item to cut quickly. In particular, investment spending by local government was curtailed even before the incisive consolidation measures adopted in 2011.
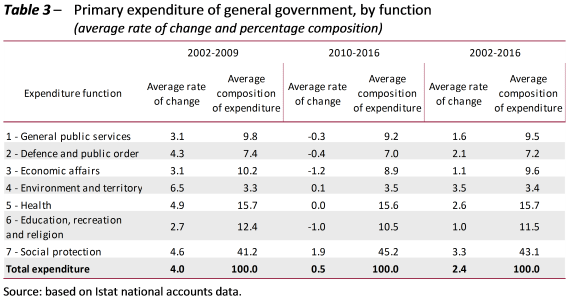
A functional analysis shows that all areas of expenditure experienced a sharp slowdown after 2009 (Table 3): in 2016, expenditure for six out of seven macro-functions (the only exception being social protection expenditure) was lower in nominal terms than in 2009, in the total amount of €15 billion. Developments in the various expenditure macro-functions in the two sub-periods evidently led to what was essentially a one-way recomposition of primary spending, with the share of social protection expenditure increasing by 4 percentage points (from 41.2 to 45.2 per cent, on average) and the share of all other functions contracting, with the sole exception of spending on environmental protection and territorial planning. The most significant reductions are found in spending on economic affairs, education and recreation, culture and religion: all of these macro-functions were significantly impacted by the cuts in spending on investment and capital grants. This is particularly true of the economic affairs function, which accounts for more than half of these two items.