Tax incentives for research and development in Italy
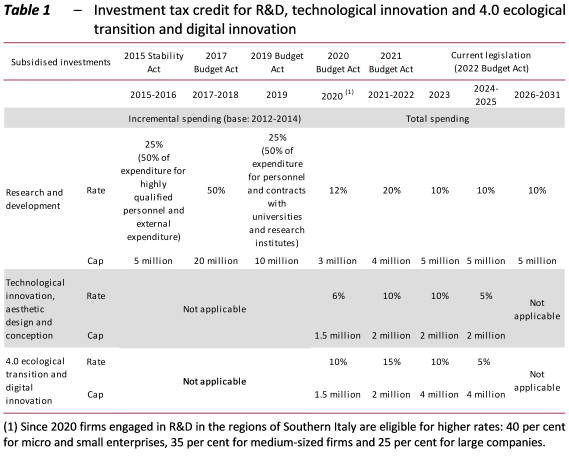
The Focus Paper “Tax incentives for research and development in Italy” (in Italian) analyses public incentives for R&D investments, evaluating the advantages they have brought to Italian companies in recent years. The study focuses in particular on tax credits for R&D spending, which have been amended over time (Table 1), and on the so-called patent box regime, which was radically transformed last year.
What is a patent box?
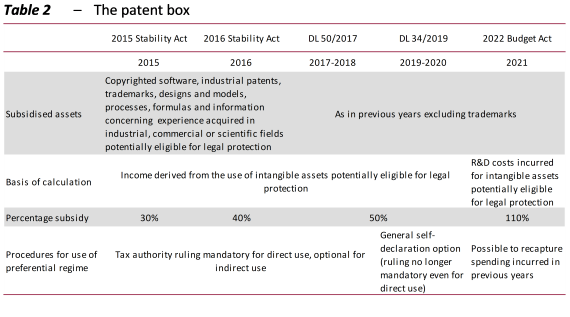
The patent box is a preferential tax regime introduced with the 2015 Stability Act that allows companies to exclude a portion of the income produced with the use of legally protected intangible assets (such as software protected by copyright or industrial patents) and the capital gains (if 90 per cent reinvested) generated by their sale from their tax base (for both income tax – IRES ‑ and regional business tax – IRAP). However, the patent box regime was changed in 2021 (Table 2): instead of exempting income from taxation, the percentage of R&D costs incurred for legally protected intangible assets that can be deducted (for the purposes of income taxes and IRAP) has been increased to 210 per cent. The current regime is more generous than the previous one for less profitable companies at any given level of costs. Consequently, the regime could provide a greater incentive to smaller firms than large companies, which were the main beneficiaries of the initial version of the patent box regime, also bearing in mind the high initial administrative costs.
Are the subsidies worth it?
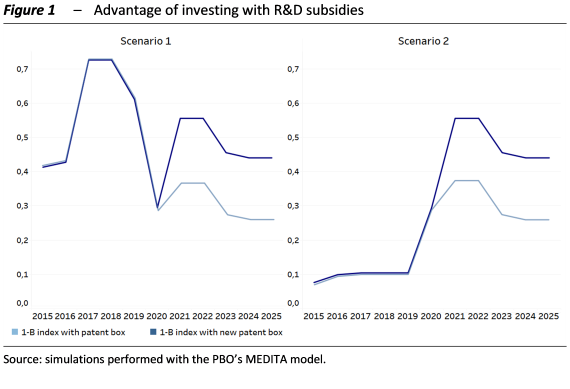
To evaluate the advantage of investing in R&D compared with other investments, the B index was used. This provides an ex ante measurement of the actual cost of one euro of R&D expenditure net of the tax savings obtained with the subsidy programmes. The analysis found the overall advantage of the incentives is particularly high until 2019, thanks to the high rates of the tax credit. This benefit decreases in 2020 with the change in the investment tax credit system and increases again in 2021, thanks both to the increase in the tax credit and the generosity of the new patent box regime. In the coming years, however, the advantage of the system seems likely to decline, reflecting the progressive reduction of the tax credit (Figure 1).
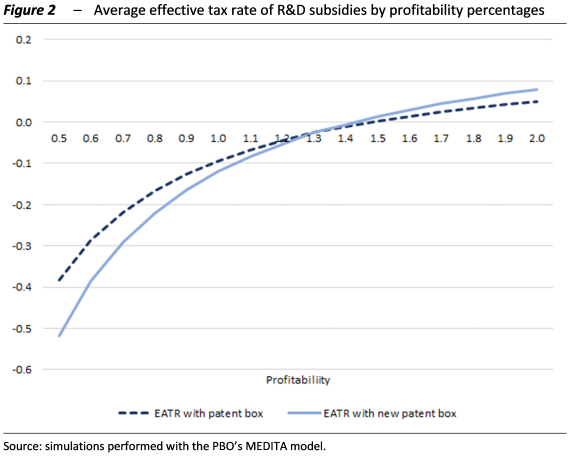
In terms of the effective average tax rate (EATR) – which combines the tax savings deriving from tax incentives on expenditure (tax deductions and credits) with the tax due on income generated by investments – the old patent box appears more advantageous than the new regime for intangible assets that generate greater profitability (Figure 2). The reversal of the advantage of the two subsidy regimes occurs at a profitability level of about 131 per cent of the initial expenditure. As the assumed interest rates vary, the profitability determining the equivalence of the two measures also varies: the higher the interest rate, the greater the profitability required for equivalence.
Costs for government greater than expected
Over the period considered (2015-2020), these measures potentially reduced tax revenue by about €17 billion, compared with a total appropriation of €6 billion. The actual cost of the subsidies turned out to be greater than that estimated not only in the first few years, but also after the various amendments of the measures. It would therefore be appropriate to evaluate the actual ability of the subsidy programmes to achieve their objectives.
How many companies have taken advantage of the subsidy programmes
The use of the incentives was analysed on the basis of the tax returns of corporations for the years 2015-2020 and the PBO’s MEDITA microsimulation model. The analysis found that the number of firms benefiting from the investment tax credit went from 10,268 in 2015 to 27,072 in 2019: a very small share, equal to about 3 per cent of the total number of corporations. The number of beneficiaries of the patent box regime also increased between 2015 and 2019, going from 555 to 1,821. The increase is significant, but involves an even smaller proportion of corporations than the tax credit.
The great majority of the beneficiaries are in the North
By territorial distribution, 66 per cent of firms benefitting from the tax credit in 2020 were in the North, just under 20 per cent were in the Centre and about 15 per cent in the South. For the patent box, territorial differences are even more pronounced: in 2019 almost 72 per cent of beneficiaries were located in the North (and benefited from 79 per cent of the subsidised eligible income), while businesses located in the South represented only 11 per cent of beneficiaries (and less than 3 per cent of subsidised income).
R&D investment: Italy still lags behind the EU average
Despite rising from 1.2 to 1.5 per cent of GDP between 2011 and 2020, Italian R&D expenditure remained consistently and significantly below the EU-27 average, which in the same period rose from 2 to 2.3 per cent. Despite the incentives, in 2020 Italy was joined in the ranking by Greece, which in 2011 was the European country that spent the least on R&D (0.7 per cent of GDP). In recent years, R&D spending has exceeded 3 per cent of GDP, the target set by the European Commission, in just six European countries: Austria, Belgium, Denmark, Finland, Germany and Sweden.
Patents: Italy tenth in Europe
The low level of expenditure is also reflected by patent applications. In 2020, the figure for Italy, with 76.5 patent applications per million inhabitants, is just over half the EU average (144.4) and ranks tenth in Europe. The top positions are still dominated by the countries of Northern Europe – Denmark, Finland, the Netherlands and Sweden – together with Austria and Germany, with values ranging from 255 to 435 patent applications per million inhabitants.
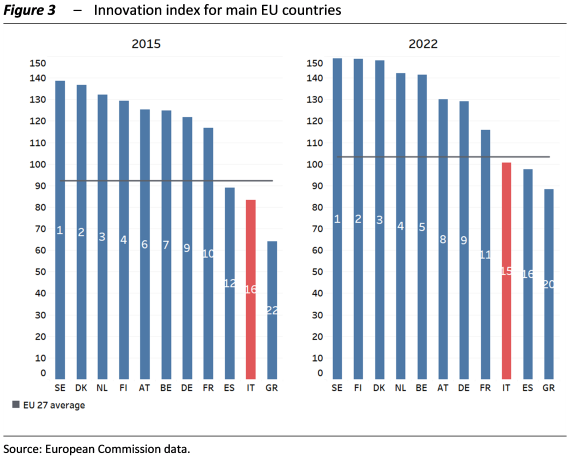
Italy on the innovation scoreboard
In addition, Italy scores low on the European Innovation Scoreboard of the European Commission, lying below the EU-27 average, although between 2015 and 2022 it did improve its position compared with other countries, moving from sixteenth to fifteenth position. (Figure 3).
Text of document (in Italian)