The member of the Board of the Parliamentary Budget Office (the PBO), Alberto Zanardi, testified (in Italian) today before a joint session of the Public and Private Sector Employment Committee and Social Affairs Committee of the Chamber of Deputies, as part of the series of hearings concerning the ratification into law of the decree on the citizenship income (CI) and pensions. Alberto Zanardi, in reviewing the analysis set out in the previous hearing, amended and updated in the light of the changes approved by the Senate, discussed a document addressing the contents of the provisions, focusing on the main characteristics of the new measures, their scope of action, the resources appropriated to finance them, and the potential critical issues they face.
Compared with other income support measures such as the inclusion income, the CI is characterised by a significant increase in the level of eligibility thresholds, the pool of beneficiaries and the amount of the benefit, as well as the public resources allocated to finance the instrument. The PBO estimates for the number of potential beneficiaries and the associated expenditure are substantially in line with those given in the technical report accompanying the measure.
Particular emphasis has been placed on offering support and assistance to those able to work and on incorporating mechanisms to prevent opportunistic behaviour or the adoption of avoidance strategies by beneficiaries. In the design of the CI, this latter approach relies more on complex coercive mechanisms than on incentives aimed at encouraging voluntary participation in the labour force.
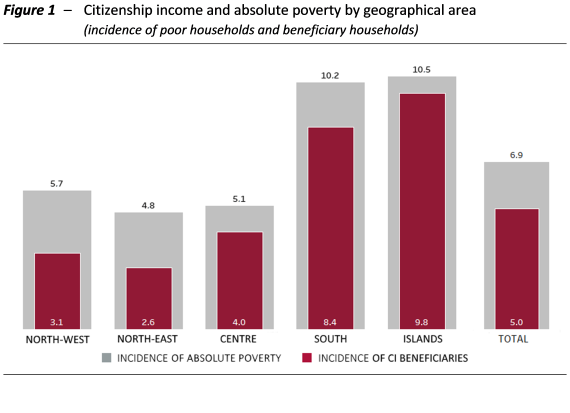
The distribution of beneficiaries is highly differentiated at the geographical level (Figure 1): 56 per cent of the beneficiary households are resident in the South and the islands, while around 28 per cent are resident in the North. While covering a high proportion of the poor at national level (72.5 per cent of potentially qualifying households, and 71.4 per cent of total individuals), the alignment between the CI and poverty varies considerably by area: the share of beneficiary households is close to that for households living in a state of absolute poverty in the South (8.4 per cent for beneficiaries in the South and 9.8 per cent for the islands, compared with a proportion of households in absolute poverty of 10.2 per cent and 10.5 per cent, respectively), significantly lower in the Centre and North (the CI reaches 3.1 per cent of households in the North-west and 2.6 per cent in the North-East, compared with a proportion of households living in absolute poverty of 5.7 per cent and 4.8 per cent, respectively). Factors behind this include, on the one hand, the uniformity of the benefit compared with the large territorial disparities in poverty thresholds and, on the other, the exclusion of some foreigners, which reduces the take-up of the citizenship income in the North, where they are more numerous.
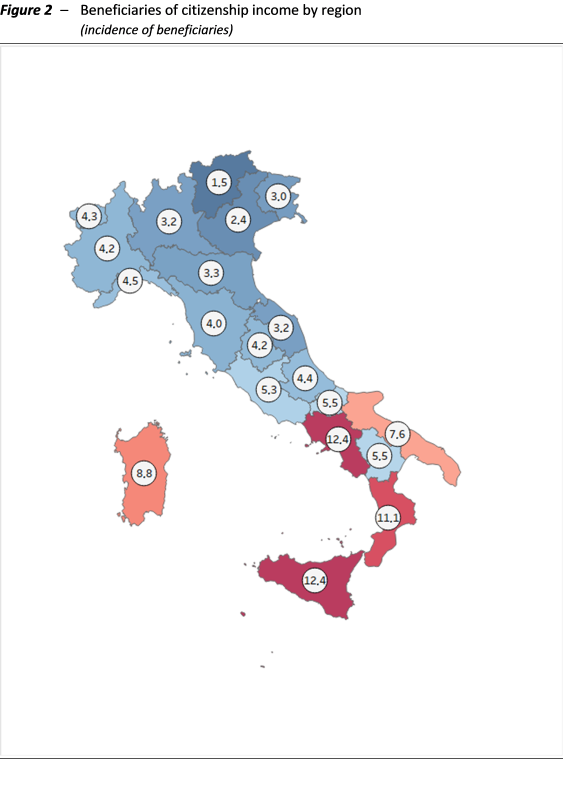
The number of potential beneficiaries of the CI also differs considerably among regions (Figure 2).
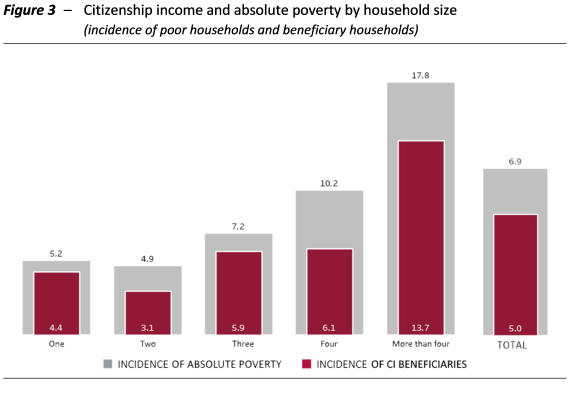
Another important issue concerns the composition of households (Figure 3). Among the absolute poor, the smallest households receive greater protection: for single-member households, 84 per cent of the total absolute poor are beneficiaries (beneficiaries represent 4.4 per cent of the population, compared with a prevalence of absolute poverty of 5.2 per cent), compared with around 77 per cent (13.7 per cent, compared with 17.8 per cent) for households with more than four members. This difference also reflects factors related to the limitation of the resources appropriated and the size of the basic benefit originally announced. This prompted the adoption of an equivalence scale, with which the CI is parameterised on the basis of the number of household members, that is substantially flatter than generally adopted in other cases and therefore less favourable to larger families.
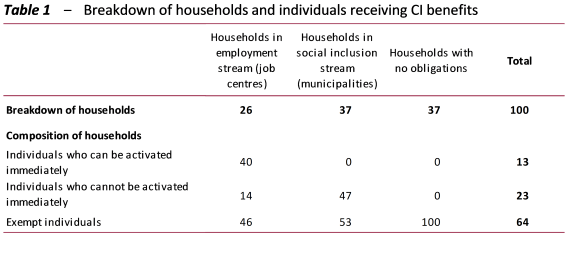
It was also possible to estimate, again on the basis of 2017 ISEE returns (equivalent economic status indicator), how households and their members could be distributed at least initially between the two different streams envisaged by the CI: the employment stream (i.e. connected with the job centres) and the social inclusion stream (through municipalities for households with a weaker chance of finding employment and facing multidimensional poverty problems).[1] The analysis found that about 37 per cent of the households would have no obligations of any kind, 26 per cent would be at least initially included in the employment stream and the remaining 37 per cent in the social inclusion stream operated by the municipalities.
However, there is considerable internal diversity among household members, except in households with no obligations, which under the CI rules may consist solely of persons with no obligations. In particular, in households initially assigned to the employment stream, 40 per cent of individuals are “readily active” (about 462,000 individuals), 46 per cent are exempt from obligations (about 539,000 individuals) and 14 per cent are “not immediately active” in the labour market (165,000 individuals). Of the households assigned to the social inclusion stream, 47 per cent of their members are “not immediately active” (about 656,000 individuals) and 53 per cent are “exempt from obligations” (about 729,000 individuals).
However, these estimates are exposed to a serious interpretative difficulty. The decree refers to a generic unspecified status of “occupation” in order to qualify for the exemption from the conditions attached to the scheme and, conversely, one of “non-employment” (for no more than two years) as a condition for referral to the job centres. In both cases, there is no reference to the duration of the employment relationship, how much the person was paid or the type of work. In the quantification performed above anyone who declared themselves “employed” in their ISEE returns and who received positive employment income in the reference year was considered “employed” (and therefore exempt from the obligations), which amounted to just under 400,000 people .
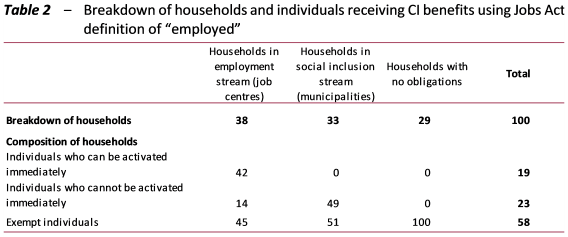
There are, however, alterative definitions of “employed”. If, for example, we use the definition of “employed” envisaged in the Jobs Act, which was also adopted in the rules of the Inclusion Income mechanism, considering only those with an annual income greater than the minimum taxable income (about €8,100 for payroll employees and €4,800 for self-employed workers), the estimated distribution of households and individuals between the two streams would change appreciably. More specifically, the number of households without obligations of any kind would decrease (from 37 to 29 per cent), while those assigned to the employment stream would increase (from 26 to 38 per cent) (Table 2). Finally, the number of households assigned to the social inclusion stream would decrease slightly (from 37 to 33 per cent). Looking at the members of the various households, the number of individuals who could be activated immediately would rise, while those exempt from any obligation would fall. In order to strengthen the anti-avoidance mechanisms, it would therefore be advisable that the criteria for qualifying for the exemption from obligations due to employment be specified more precisely in the decree.
The design of the CI is characterised by the weakness of incentives to participate voluntarily in the labour force. When a potential beneficiary applies for the benefit, all earned income is included in the income of the household to be supplemented with the CI, which corresponds to an implicit 100 per cent tax rate if the earned income is equal to or less than the threshold. Low-paid workers will therefore have an income equal to those who do not work at all. Moreover, this disincentive is increased by the fact that the size of the CI benefit could displace segments of the labour force ‑ especially in the South – receiving especially low wages in part-time or non-permanent jobs, for whom work would no longer be economically advantageous.
As for the coercive measures, the main disincentive to opportunistic behaviour is an obligation to accept suitable job offers. The credibility of this mechanism is not obvious and will depend on the actual amount of frictional unemployment, on the effectiveness of job centres in matching labour supply with demand and on the benefits that firms perceive in using CI beneficiaries to fill their own vacancies.
With regard to pensions ‒ the main measure being the so-called “quota 100”, representing the sum of a workers age and years of contributions ‒ the simulations conducted by the PBO generate results that are substantially in line with the official estimates as regards both the increase in the number of pensions paid in the next ten years and the associated increased in expenditure. The increase in the number of pensions at the end of the year would amount to just over 314,000 in 2019, then rise to just over 372,000 in 2021, before gradually declining to about 150,000 in 2028. The increase in gross expenditure would amount to about €4 billion in 2019, increase to about €8.6 billion in 2021 and begin to decrease more rapidly from 2024 (about €1.4 billion in 2028).
Bearing in mind the fact that early retirement reduces the size of the pension but increases the number of years that beneficiaries will receive it, the “quota 100” will be advantageous for most of those who qualify in 2019, especially if they have a defined-benefit pension and a discount rate of more than 3 per cent.
If instead of the take-up rate adopted in the technical report, we assume a rate of 90 per cent for private-sector workers and 85 per cent for public-sector employees, the increase in the number of pensions at the end of the year would be around 9 per cent larger. Expenditure would increase by an additional 5.8 per cent in 2019 and about 10 per cent in the other two years. Applied directly to the expenditure forecasts in the technical report (for the quota 100 mechanism, the new early retirement pension and “woman’s option”), these percentages increase expenditure by about €0.2 billion in 2019 and about €0.8 billion in 2020 and 2021. If a take-up rate of 100 per cent were assumed for both private and public-sector workers (i.e. everyone takes advantage of the quota 100 scheme to retire as soon as they can), the increase in the number of pensions at year-end would rise by around 22.8 per cent in 2019, 14.7 per cent in 2020 and 13 per cent in 2021, with an additional increase in expenditure of 14.2 per cent in 2019, 19.4 per cent in 2020 and 13.9 per cent in 2021.
The economic literature and empirical analyses do not offer unambiguous conclusions about the scope for intergenerational turnover triggered by early retirement. In the short term, the contraction in employment of the older age groups that will be produced by the quota 100 mechanism could stimulate moderate generational turnover, especially in the public sector. In the long term, however, employment of both the young and the elderly will depend on the effectiveness of the incentives for economic growth implemented by the Government.
The high level of uncertainty of the estimates for the costs of the measures contained in the decree have prompted the creation of different monitoring mechanisms for the citizenship income and pension, on the one hand, and the pension system reform, on the other. These mechanisms, although essential for controlling expenditure, face a number of critical problems that need to be carefully evaluated.
[1] After initial assignment of households to one of the two streams, in cases of multidimensional poverty the decree provides for municipalities and job centres to cooperate in delivering the most appropriate services. This could lead to the subsequent reassignment of households to another stream.