2024 and future prospects
The macroeconomic outlook and forecasts
The international and Italian economy
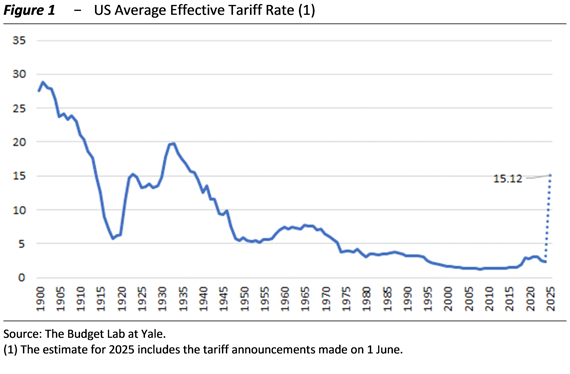
The already fragile international context has rapidly deteriorated this year, mainly due to the escalation of the trade war initiated by the United States of America, which has increased uncertainty. At present, the tariffs imposed by the United States are at historic highs (Figure 1), likewise global uncertainty. Quantifying the economic impact of the new trade barriers is highly uncertain, not least because of repeated denials by the US administration of its announcements. The prevailing estimates point to adverse impacts, albeit of highly variable magnitude and significantly differentiated across countries and sectors. The transmission of the impacts of tariff barriers will crucially depend on several factors, such as the duration of the tariffs, retaliation by other countries and the reactions of other operators involved: financial markets, businesses, households and, not least, central banks.
According to PBO estimates, the sectors of the Italian economy most affected by US tariffs would be the pharmaceutical industry, mining and vehicle manufacturing. From an employment perspective, the most significant losses would be concentrated in sectors that are most labour-intensive, such as metal manufacturing, machinery and textiles. Mining would suffer a sharp loss of value added, despite the low share of exports to the United States and the low tariff rate, as it is highly interconnected with other sectors. Significant effects are also expected on some service sectors not directly affected by the tariffs, such as professional activities (architectural, engineering, legal, accounting and management), advertising, and personnel research and supply services. The results are derived from a comparative static exercise using cross-sector tables, which therefore does not incorporate time dynamics or strategic reactions by economic operators.
The exogenous variables in the 2025 Public Finance Document (PFD) factor in the deterioration in the international environment that occurred between last autumn and spring. Global trade showed a moderate recovery between the end of 2024 and the beginning of 2025, but in recent months expectations have deteriorated sharply due to the intensification of protectionist policies. Energy commodity markets continue to experience considerable volatility, influenced by geopolitical factors and supply and demand dynamics. Central banks are responding to the greater global uncertainty with a more cautious monetary policy stance, as are households and businesses with their consumption and investment decisions. The ECB recently cut its key interest rates further, but remains cautious about the outlook, and long-term interest rate expectations are rising. The high level of uncertainty in recent months has affected currency markets differently than in the past; the dollar has depreciated sharply following the new US administration’s announcements on the trade war, whereas historically it has been a safe-haven currency that strengthened in times of instability.
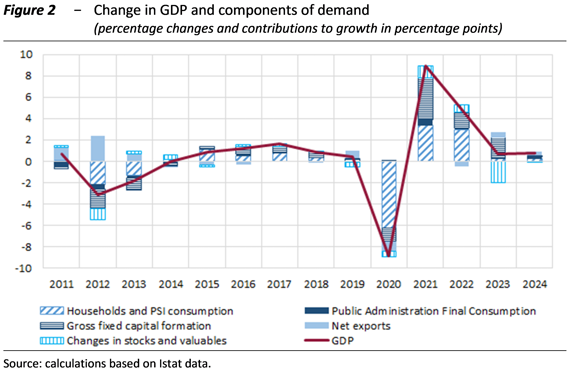
In 2024, Italian GDP grew by 0.7 per cent (Figure 2), falling below the euro area (0.9 per cent) for the first time since 2021. Household consumption rose modestly (0.4 per cent) as the propensity to save increased. The change in investment (0.5 per cent) normalised compared with the robust post-pandemic trend and was driven by construction and intellectual property products. On the supply side, value added was driven by services last year, while industrial production continued to decline, showing only weak signs of recovery in the final months of 2024.
Inflation declined while employment remained buoyant. NIC-measured inflation in 2024 fell to 1.0 per cent in Italy, before realigning slightly below the European level, at around 2.0 per cent in recent months. As regards the labour market, employment rose by 1.6 per cent in 2024 and the unemployment rate fell to 6.5 per cent on average for the year. Contractual wages rose by 3.0 per cent in 2024, outpacing inflation, although in real terms they remain significantly below 2021 levels.
Demographic and climate trends pose significant structural challenges in the medium to long term. The downward trend in births is continuing: the fertility rate of 1.18 children per woman in 2024 is the lowest since 1995. Internal migration is exacerbating regional disparities, with the number of residents in the South declining and those in the North increasing. On the environmental front, CO2 emissions in Italy fell in the two-year period 2023-24, but the 2024 winter was the warmest since 1800. Italy is exposed to climate change to varying degrees across different areas; rising temperatures may also have an impact on business demographics, thereby exacerbating regional disparities. In Europe, Mediterranean countries are the most affected by climate change and are also the least able to adapt due to limited fiscal space.
Post-pandemic construction incentives have provided a strong stimulus to economic activity, but with diminishing returns over time. The expansion of residential construction incentives after the pandemic has been one of the main fiscal stimulus measures implemented in Italy, combining economic recovery objectives with social and environmental goals. The adoption of these measures generated a significant boost to housing investment, according to the counterfactual analysis conducted by the PBO using the synthetic control method and the MeMo-It macroeconometric model. In 2020-23, the cumulative overall impact on GDP of additional residential investment is estimated at almost four percentage points, albeit with some pressure on prices. The additionality of the measures was high in the immediate aftermath of the health crisis but then declined significantly. In particular, in 2022-23, only 60 per cent of investment was made thanks to the incentives, raising questions about the measure’s efficiency in the medium term.
Macroeconomic forecasts
Last year, the government’s macroeconomic forecasts were broadly stable and the 2025-29 Medium-Term Fiscal-Structural Plan (MTP) projections for GDP in 2024, net of quarterly data revisions, were accurate. Compared with the EFD 2024 baseline scenario, the MTP confirmed the change in GDP for the two-year period 2025-26 (Figure 3), with growth revised only marginally for 2027. The forecasts incorporated the general revision of the annual national accounts for 2024, but not the new quarterly national accounts, as these were published by Istat after the MTP. The new infra-annual data worsened the outlook for 2024 by two-tenths of a percentage point, due to lower growth in the fourth quarter of 2023. Net of this statistical revision, the MTP’s forecast for GDP in 2024 was therefore broadly on target (of the three-tenths of a percentage point of forecast error, two depend on revisions to the quarterly data for 2023); the MTP’s forecast for nominal GDP in 2024, which has a significant impact on public finance estimates, was on target.
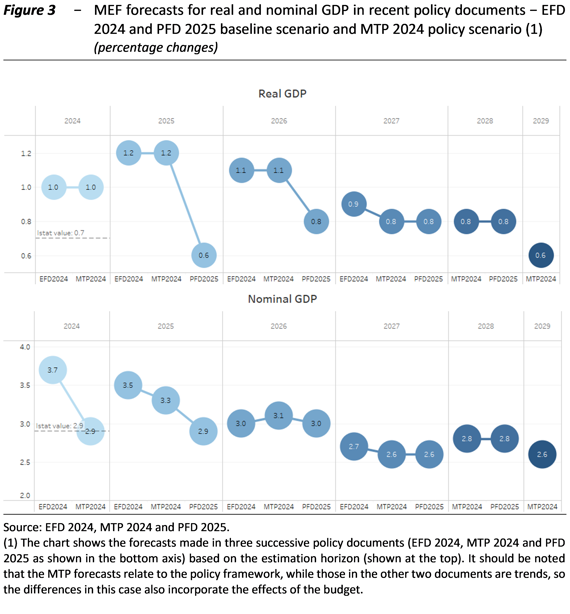
The macroeconomic forecasts in the 2025 PFD have been significantly revised downwards, mainly due to protectionism. The exogenous variables underlying the PFD, formulated in the first half of March, partly anticipated the subsequent measures on the trade war, the developments of which are still ongoing. The macroeconomic trend scenario (QMT; the programme scenario was not presented by the government) of the PFD significantly revised downwards the real GDP expectations for 2025 and 2026, which had remained virtually unchanged between the 2024 EFD and the 2024 MTP. Except for 2024, the downward revision of nominal GDP has been more gradual in the last three planning documents.
The PBO has validated the macroeconomic framework of the PFD 2025 for the four-year forecast period 2025-28, as the expectations for the main variables appear to be within an acceptable assessment range. Economic growth estimates never exceed the upper limit of the range defined by the PBO panel, although they are at that extreme in two of the four years covered by the forecast. At the end of the period, in 2028, the level of real output in the MEF scenario would be 3.0 percentage points higher than in 2024, marginally above the panel’s maximum value. For nominal GDP, the cumulative increase outlined by the MEF coincides with the upper limit of the panel.
Despite developments in the trade war since the document was published, the macroeconomic scenario of the PFD currently appears consistent with the expectations of other institutions and private analysts. The PFD was approved by the Council of Ministers on 9 April. Since then, there have been important, and in some cases uncertain, developments in the trade war and on the financial markets. However, the GDP forecasts in the PFD appear consistent with the most recent forecasts by institutions and private analysts; there are no significant deviations in nominal GDP either, although the MEF’s expectations for the deflator appear slightly higher than those of other forecasters.
The PBO forecasts point to a phase of moderate expansion of the Italian economy this year and slightly higher growth in the following years. The PBO’s GDP expectations are the same as those of the MEF for 2025 but are slightly more cautious for the following years. Economic activity is expected to be supported by the easing of inflationary pressures, the stability of employment and, until 2026, the boost from the National Recovery and Resilience Plan (NRRP). As regards prices, the consumption deflator is expected to accelerate to 2.2 per cent in 2025, before slowing moderately. On the labour market, the PBO scenario points to a consolidation of the expansionary phase, following the buoyant performance in 2024.
The PBO emphasises that the Italian economy is exposed to various risks, mainly on the downside. The forecasts are subject to exogenous and external shocks, such as wars, geopolitical tensions and, in particular, protectionism. On the domestic front, there is considerable uncertainty about the evolution of the NRRP, given the deadline expected for next year. There is also uncertainty about the next moves by central banks, which have become more cautious following the rise in protectionism. Against this backdrop, environmental and climate issues remain critical and increasingly pressing.
To provide an initial assessment of some of the risks mentioned, alternative scenarios to the PBO’s baseline forecast presented last April have been developed, with reference to the deterioration in foreign demand due to tariffs and the possible postponement of the NRRP (other scenarios are presented below, together with an analysis of military spending). In the alternative scenario of higher tariffs, the slowdown in foreign demand leads to lower GDP growth in Italy, by two-tenths of a percentage point in 2026 and one-tenth in 2027. On the other hand, the postponement of part of the NRRP expenditure to 2027 would lead to a decline of three-tenths of a percentage point in GDP growth in 2026, a jump of eight-tenths in 2027 and a further decline in 2028; the sum of the deviations from the baseline forecast is essentially zero over the entire period, so cumulative growth in 2028 is equal to that in the baseline simulation, which assumes the conclusion of the NRRP next year.
For several years now, the PBO has been conducting retrospective analyses of the accuracy of official macroeconomic projections, as agreed in the memorandum of understanding with the MEF on forecasts. Taking into account that the last five years have been marked by exceptional events of a non-economic and unpredictable nature, such as the pandemic and the war in Ukraine, the forecasts for real and nominal GDP appear acceptable ex-post. Over the last five years, the MEF’s forecasts for GDP growth in volume terms for the following year have tended to be overestimated, but those for the current year appear cautious and, on average over the four horizons, the positive bias (i.e. the optimism of the estimates) is acceptable. Expectations for nominal GDP, which impact public finance estimates, have been underestimated on almost all horizons, except for the year following the current year. On average over the four horizons, the distortion is negative and higher (in absolute terms) than the positive distortion of GDP in volume; these diagnoses are affected to a not negligible extent by the revisions of the national accounts made in recent years, which have tended to revise GDP data upwards. The MEF’s forecast errors are similar to those of the PBO and the European Commission (EC), both in terms of size and distortion. The overestimation of GDP forecasts in the T+1 and T+2 horizons is acceptable overall, considering that the reference period s exceptional and entirely unforeseeable events, such as the pandemic and the war in Ukraine.
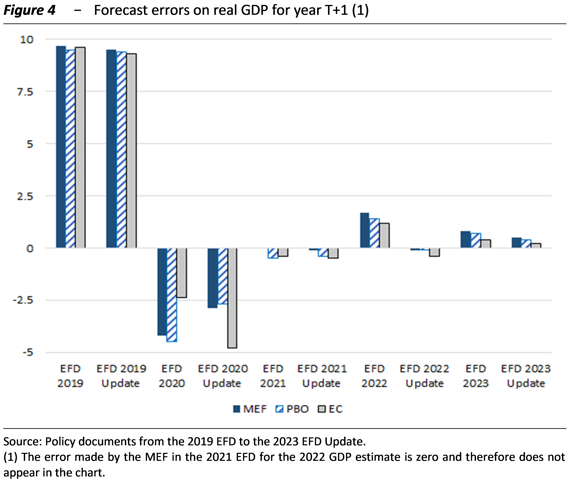
The error made by the MEF in its one-year-ahead forecasts of real GDP over the last five years is always of the same sign as that of the other forecasters, but is slightly larger. In the succession of different forecast documents, there is no clear persistence of the sign of the forecast errors (Figure 4), confirming the non-systematic nature of the distortion. The diagnostics for 2020-24 are greatly affected by the shock attributable to the COVID-19 pandemic; net of anomalous data, the distortion of one-step-ahead forecast errors appears much smaller for the three forecasters considered, but slightly larger for the MEF.
Public finance
Public finances in 2024
The general government deficit in 2024 was 3.4 per cent of GDP, down from 7.2 per cent in the previous year, mainly due to the lower impact of the Superbonus. The figure was better than expected, thanks mainly to higher revenues, particularly from personal income tax, which was affected by wage increases and fiscal drag effects. The primary balance returned to positive territory after four years, at 0.4 per cent of GDP.
Primary expenditure, the main component of the net expenditure indicator under the new EU governance, fell by 4.6 per cent, which appears to be in line with the targets presented in the MTP and confirmed in the 2025 Draft Budgetary Plan (DBP). The tax burden stood at 42.6 per cent of GDP, up 1.2 percentage points on the previous year.
Interest expenditure as a percentage of GDP increased slightly to 3.9 per cent from 3.7 per cent in 2023, due to the gradual impact of interest rate increases in previous years.
The debt-to-GDP ratio halted its decline of the previous three years and rose again, reaching 135.3 per cent. The increase is mainly due to the growing cash impact of tax credits for construction matured in previous years (in particular the Superbonus).
The overall deficit is still 2 percentage points of GDP higher than in 2019; however, this difference is almost entirely due to the higher capital deficit, mainly linked to higher public investment expenditure and, secondarily, to investment grants, also in relation to the NRRP measures for which loans have been requested from the EU. By contrast, current primary expenditure as a percentage of output returned to levels broadly in line with those in the pre-pandemic period. At the same time, total revenue as a percentage of GDP fluctuated only slightly compared with the 2019 level. Finally, the debt-to-GDP ratio remains 1.4 percentage points higher than in the year before the pandemic.
The 2025-29 Medium-Term Budgetary Framework
Last October, the Government presented its first Medium-Term Fiscal Structural Plan to the EU, setting out a five-year programme (from 2025 to 2029) for public finances, reforms and investment. The Government has requested that the period for adjusting public finances be extended to seven years. In view of a more gradual budgetary consolidation and financial stabilisation, the Government has committed to implementing reforms and investments according to a precise timetable, also in line with the NRRP.
Compared to the 2024 EFD, the Plan revised downwards the trend deficit for each year of the 2024-27 period, by an average of 0.7 percentage points of GDP. Specifically, the deficit was estimated at 3.8 per cent of GDP in 2024, down from 7.2 per cent in the previous year, and gradually declining to 2.9 per cent in 2025, 2.1 per cent in 2026 and 1.5 per cent in 2027. The baseline scenario reflected the results of the monitoring of public accounts during the year, the effects of a further forward rescheduling of the NRRP, the revision by Istat of the final national accounts data and a change in the methodology used to develop interest rate scenarios.
The setting of new deficit targets, albeit in a context of fiscal consolidation, created budgetary room for manoeuvre compared with the current legislation framework, which would be used in the 2025 budget. In particular, the deficit target as a percentage of GDP was set at 3.3 per cent in 2025, 2.8 per cent in 2026 and 2.6 per cent in 2027. Net measures to increase the deficit were therefore planned at 0.4 percentage points of GDP for 2025, 0.7 in 2026 and 1.1 in 2027. The target of reducing the deficit to below 3 per cent in 2026 was also confirmed, thus paving the way for exit from the excessive deficit procedure (EDP) in the following year. This budgetary leeway, together with other financial measures identified in the budget, would be used, in particular, to confirm and make structural various temporary provisions of previous budgetary measures and to support healthcare spending and public investment.
The planned growth in net expenditure under the MTP was set at an average of 1.5 per cent over the seven years 2025- 2031 of the adjustment period, in line with the European Commission’s reference trajectory. However, its timing differed from that of the latter. The MTP’s planned net expenditure path envisaged growth of 1.3 per cent in 2025, rising in the following two years to 1.9 per cent in 2027 and falling in the final two years of the programme to 1.5 per cent in 2029. In 2030-31, the last two years of the seven-year adjustment period, net expenditure growth was further reduced to 1.1 and 1.2 per cent.
The debt-to-GDP ratio was expected to increase until 2026 and then decline at an accelerating pace from 2027 to 2029 and in the medium term. In particular, debt was expected to rise to 135.8 per cent of GDP in 2024, 136.9 per cent in 2025 and 137.8 per cent in 2026, representing an increase of 3.1 percentage points over the three-year period 2024-26. From 2027 onwards, debt was expected to decline, reaching 134.9 per cent in 2029. The decline continued in the medium term, reaching around 114 per cent of GDP in 2041.
The PBO has assessed the policy path set out in the Plan as being in line with the new rules of the Stability and Growth Pact (SGP). The path involves a challenging and protracted budgetary adjustment, capable of ensuring a plausible reduction in the debt-to-GDP ratio in the medium term, while preserving public investment. In the 2025-26 period, the consolidation effort will be mitigated by investments financed by EU grants linked to the NRRP (in addition to the usual cohesion funds) and, subsequently, by the contribution to growth of the MTP reforms and investments, in particular those useful for extending the adjustment period.
However, the achievement of the MTP targets is subject to risks and some elements of uncertainty. In the short term, risks relate to the full implementation of the NRRP reforms and investments and the effective implementation of the asset disposal programme assumed in the evolution of the debt-to-GDP ratio. In the medium to long term, risks stem from demographic transition, the impact of climate change and the energy transition, as well as geopolitical uncertainty.
Preliminary assessments of the effects of extreme weather events in Italy show an annual impact on public finances that could reach 5.1 percentage points of GDP in 2050 if current climate change policies remain unaltered, while it could be reduced to 0.9 with globally coordinated policies to achieve carbon neutrality by 2050. This impact is only one of four channels through which climate change affects public finances. In addition to acute physical risks, namely the increased frequency and intensity of extreme weather events, which have an impact on public spending, there are chronic physical risks, that is rising temperatures and more extreme and unstable weather, which can reduce productivity and GDP and thus revenues. Furthermore, adaptation expenditure, which can reduce the impact of both chronic and acute physical risks, and mitigation expenditure, which can help reduce emissions and thus temperature increases, must also be considered.
The European Commission assessed Italy’s proposed net expenditure path as consistent with the requirements of the SGP and considered that the budgetary adjustment path met the requirements of the excessive deficit procedure. Consequently, on 21 January, the Council adopted the MTP, recommending that Italy limits net expenditure growth in the period 2025-29 to the annual and cumulative rates set out in the document.
In its first assessment of the implementation of the MTP published in the European Semester Spring Package on 4 June, the Commission assessed Italy’s budgetary adjustment as being in line with the corrective path recommended to bring the excessive deficit procedure to an end.
Public finances in 2025 and in the two-year period 2026-27
Last autumn, in line with the objectives of the MTP, a budgetary plan was drawn up that made almost full use of the available budgetary space. Unless there are improvements in net expenditure dynamics compared to initial projections, any new measures will therefore have to be financed through revenue increases or structural expenditure reductions. The measures include stabilising the effects of the reduction in social security contributions for employees – through the introduction of a bonus and specific deductions for employees – and merging personal income tax rates, as established in the enabling law for tax reform for 2024 only. These changes, while providing greater stability to the system, also increase the sensitivity of personal income tax to inflation, especially for employees. According to estimates obtained using the PBO microsimulation model, in the transition from the 2022 regime to the 2025 regime, the additional tax burden associated with 2 percentage points of inflation is higher by about 370 million (+13 per cent). In a context where wage growth is already insufficient to offset inflation, the intensification of the tax burden resulting from the interaction between inflation and the progressive nature of the tax risks significantly eroding nominal wage increases, with potential negative repercussions on consumption and domestic demand.
On 10 April, the Government submitted the 2025 PFD to Parliament, which included the Annual Progress Report (APR). This is a transitional document, pending the amendment of national public finance legislation. The document updates the trend scenario for the three-year period 2025-27 and provides only some indications for 2028.
The trend deficits outlined in the PFD for the period 2025-27 confirm the MTP’s target values despite the weakening of economic growth forecasts, thanks to an upward revision of revenues, also due to better-than-expected results for 2024 (Figure 5). The public deficit would gradually decline over the three-year period, from 3.4 per cent of GDP in 2024 to 3.3 per cent in 2025, 2.8 per cent in 2026 and 2.6 per cent in 2027, with an average annual decrease of 0.3 percentage points. In 2028, the deficit would stand at 2.3 per cent of GDP, in line with the MTP target.
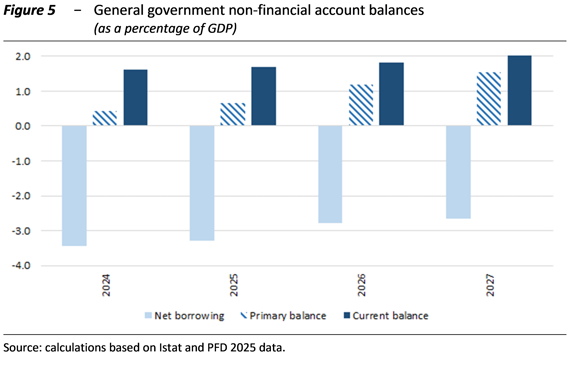
The primary surplus would continue to improve, reaching 1.5 per cent of GDP in 2027, while interest expenditure as a share of GDP is projected to increase from 2026 onwards, reaching 4.2 per cent in 2027. The evolution of interest expenditure reflects the rise in interest rates that took place last March, which was widespread across all euro area countries, and high levels of issuance to finance cash requirements.
Under the scenario based on current legislation, the PFD projects that the debt-to-GDP ratio will continue to rise until 2026, reaching 137.6 per cent, before declining in 2027-28 to 136.4 per cent. Compared with the estimates contained in the MTP, the debt-to-GDP ratio is slightly more favourable until 2027 and in line with the target for 2028.
The PBO welcomed the confirmation, within the framework of the current PFD legislation, of the main objectives set out in the MTP and endorsed by the EU Council. However, the public finance framework presents several elements of uncertainty related to the economic outlook, the implementation of the NRRP and the emergence of new budgetary priorities. As regards macroeconomic developments, the risks are on the downside, stemming from increasing market volatility and tensions in the international environment, the effective implementation of the NRRP and the climate and environmental transitions. With regard to the implementation of the NRRP, there is a significant risk that expenditure will not be fully implemented by the end of 2026. In addition, new budgetary priorities are emerging, in particular the need to strengthen the defence sector in a context of general geopolitical uncertainty. Finally, the projected decline in the debt-to-GDP ratio in 2027 depends on particularly favourable assumptions about the stock-flow adjustment component, in particular with regard to the privatisation programme and the reduction of cash holdings.
It is also important to highlight certain aspects of the MTO in the context of the ongoing amendment of the national public finance legislation to take account of the reform of European economic governance.
The 2025 PFD is presented as a transitional document. A middle ground has been chosen between the minimum information required at EU level for the APR and what is currently required by national legislation: the PFD contains more information than the minimum required by the new European governance rules, but only part of what is usually presented in the EFD.
The PFD has updated the trend scenario for the three-year period 2025-27 and provided only some indications for 2028, thus presenting itself as an update rather than a planning document, useful for setting out in advance the content of the budgetary measures to be presented in the autumn. The absence of planning guidelines can be justified by the fact that, on this occasion, the public finance outlook did not differ from the objectives set out in the MTP in terms of either net borrowing or net expenditure. Looking ahead, should a discrepancy emerge in the net expenditure path, it would be desirable to indicate the targets for general government net borrowing and the corresponding debt dynamics, consistent with the net expenditure limits set in the MTP approved by the EU Council and to be confirmed, outlining the necessary corrective measures.
The policy guidelines on the main measures of the budget were postponed until shortly before the budget law. In contrast, the EFD informed Parliament and the public, albeit in general terms, of the areas in which the Government intended to take action in the next budget and the sectors from which the necessary funding would come.
The presentation of the PFD could have been an opportunity to align the forecast and planning horizon with that of the MTP. This would have strengthened the medium-term orientation of budgetary planning, as required by the new European governance. Stronger medium-term planning has benefits in terms of the stability and predictability of budgetary objectives and public intervention in general, helps to reduce uncertainty and create an environment conducive to broad-based intervention by the public sector and economic operators, and enhances the Parliament’s steering and control capacity.
It would be desirable, when revising Law 196/2009, to consider the advisability of maintaining a comprehensive trend framework for the entire horizon and starting the annual budgetary planning cycle in the first half of the year.
Thematic insights
EU initiatives in the defence sector and their implications for Italy
EU initiatives in the defence sector and their implications for Italy
Last March, the European Commission presented the ReArm Europe Plan – Readiness 2030, a strategic package aimed at encouraging a significant increase in Member States’ spending on defence and security.
The proposal put forward by the Commission present a variety of lines of action to strengthen Member States’ defence capabilities. Firstly, Member States have been invited to activate, in a coordinated manner, the national escape clause. The clause would allow Member States to deviate from their net expenditure limits as set by the Council of up to 1.5 percentage points of GDP per year over the period 2025-28, provided that this margin is used to finance higher defence spending (as a share of GDP) than the level recorded in 2021. The activation of this clause would still require that the deviation does not compromise medium-term debt sustainability. The flexibility applies to expenditure classified under the European System of National Accounts (ESA2010) in the classification of functions of government (COFOG) for defence. The Commission had initially invited Member States to request the activation of the clause by 30 April, but its activation is also possible after that date. To date, 16 Member States have submitted such a request: Belgium, Bulgaria, the Czech Republic, Denmark, Germany, Estonia, Greece, Croatia, Latvia, Lithuania, Hungary, Poland, Portugal, Slovenia, Slovakia and Finland.
Secondly, the Commission has proposed the creation of a new temporary financial instrument, SAFE (Security Action for Europe), based on Article 122 of the Treaty on the Functioning of the EU, which allows the Council to grant financial assistance to Member States in exceptional circumstances. The regulation establishing SAFE was adopted by the Council of the European Union on 27 May. This financial instrument will provide loans to Member States up to a total amount of €150 billion, guaranteed by the EU budget, to support the strengthening of their defence capabilities through joint procurement, thereby promoting the interoperability of armed forces, the realisation of economies of scale and the consolidation of the European defence industrial base.
As a further measure, the Commission has proposed incentives for Member States wishing to redirect unused cohesion funds to projects enhancing defence production capabilities and investments in transport infrastructure with dual civil and military use. The package presented by the Commission also includes broadening the financial assistance offered by the EIB to investment projects in the defence sector and accelerating on the Savings and Investments Union.
The effectiveness of the ReArm Europe Plan – Readiness 2030 will depend on a number of governance and budgetary factors. First, the willingness of Member States to further integrate their defence systems by exploiting economies of scale and scope, as well as to increase the resources allocated to the sector, will be crucial. In this regard, many Member States may not have sufficient budgetary room to increase spending adequately and therefore make use of the national escape clause and SAFE loans. The success of the strategy would be better ensured by an increase in spending financed at EU level and a greater centralisation of strategic decisions.
According to the COFOG classification, in 2023 Italy allocated €25.6 billion to defence, corresponding to 1.2 per cent of GDP. In that year, Italy’s spending was slightly below the EU average of 1.3 per cent of GDP. The distribution of expenditure shows a concentration of 71.2 per cent on current expenditure, amounting to €18.2 billion (0.9 per cent of GDP). The remaining €7.4 billion (0.3 per cent of GDP) is allocated to public investment. In Europe, the countries that allocate the highest share of public resources to defence in relation to GDP are the Baltic countries (Estonia, Lithuania and Latvia), followed by Greece and Poland, which are the five EU Member States where spending had already exceeded the 2 per cent of GDP target in 2023. France historically devoted more than 2 per cent of GDP to defence until 2000, reducing the share of spending in the following two decades to around 1.7 per cent. Germany and Spain allocated more modest resources to defence, with a downward trend until the early 2000s and subsequent stabilisation at around 1 per cent of GDP.
In its spring package, the Commission paid particular attention to the dynamics of Member States’ defence spending. In the Commission’s forecasts, Italian defence expenditure under the COFOG definition is estimated at 1.3 per cent of GDP in 2024 and 2025, representing a decrease of 0.1 percentage points compared to the 2021 level. Based on these projections, the Commission has called upon Italy to increase its overall defence spending in accordance with the conclusions of the March European Council.
Using the NATO accounting methodology for defence expenditure, which is broader than the COFOG classification, Italian expenditure in 2024 is estimated at 1.5 per cent of GDP, showing significant growth compared to 1.1 per cent in 2014. Preliminary estimates for 2024 also indicate that France and Germany have reached defence spending levels of just over 2 per cent of GDP, while Poland, Greece and the Baltic countries (with the exception of Lithuania) remain the EU countries with the highest ratios, exceeding 3 per cent of GDP.
The breakdown of Italian defence spending according to NATO categories shows that Italy, together with Portugal, would have allocated almost 60 per cent of total spending to military and civilian personnel in 2024, compared to an average of 38 per cent among EU Member States who also participate to NATO. As a result, Italy’s share of military equipment, including research and development, would be lower than the average for EU Member States participating in NATO (22 per cent compared to an average of 32 per cent), as would its share of operational, maintenance and logistics expenditure (16 per cent compared to an average of 25 per cent). The share allocated to infrastructure is around 4 per cent of the total, in line with the average of EU member countries that are also NATO members. However, for Italy, over the last decade, the share absorbed by personnel expenditure has fallen from 76.4 per cent of the total in 2014 to 59.4 per cent in 2024 (preliminary estimates), while the share allocated to equipment and investment has almost doubled.
The financial planning contained in the budget law for 2025 provides for allocations for the ordinary defence budget of €31.3 billion for 2025, €31.2 billion for 2026 and €31.7 billion for 2027. The increase compared to the scenario under current legislation, resulting from the budgetary measures for 2025, amounts to a total of €3.9 billion in the current year, €3.3 billion in 2026 and €4.6 billion in 2027. The DFP highlights the allocation of 35 billion for investment in the defence sector between 2025 and 2039, of which approximately €22.5 billion will go directly to the Ministry of Defence.
Given the high level of debt-to-GDP ratio, Italy’s main challenge will consist in balancing any potential increase in defence spending with the need to maintain the sustainability of public finances, considering the medium and long-term implications on public debt and the need to comply with the EU fiscal rules.
The PBO has assessed, using the macroeconomic models MeMo-It and QUEST III R&D, the potential macroeconomic impact for Italy of the possible activation of the safeguard clause provided for in the ReArm Europe Plan – Readiness 2030. Two scenarios of deficit-financed increases in public spending were simulated for the period 2025-28. The first scenario envisages, compared with the baseline scenario, a moderate increase in defence spending, equal to 0.25 percentage points of GDP in 2025 and 0.5 percentage points per year in the three-year period 2026-28. The second scenario also envisages an increase of 0.25 percentage points of GDP for the current year, followed by a gradual increase up to the maximum allowed of 1.5 percentage points in 2028.
Simulating the scenario of a moderate increase in defence spending using the MeMo-It model, the effects on growth are slight and temporary, with a cumulative increase of 0.3 percentage points of GDP in 2025-28. The scenario assuming a more marked increase generates prolonged effects, with an annual impact of up to 0.3 percentage points in 2027-2028 and a cumulative effect of close to one percentage point in 2025-28.
The QUEST III R&D model, which incorporates supply-side mechanisms and the reaction of monetary policy, confirms for the first scenario the order of magnitude of the macroeconomic effects estimated with MeMo-It. In the second scenario, the expected increase in real interest rates, induced by operators’ expectations, causes a crowding-out effect on private investment and consumption, which initially reduces the impact on GDP growth for 2025 and 2026. However, in 2027 and 2028, thanks to the increase in productivity resulting from the accumulation of public capital and the expected decline in future interest rates, annual GDP growth would be equal to 0.3 and 0.6 percentage points respectively, with an estimated cumulative effect of 1.1 percentage points of GDP in the years 2025-28.
The PBO also assessed the medium-term sustainability of the debt-to-GDP ratio in the event of activation of the national safeguard clause proposed by the Commission. Italy’s debt-to-GDP ratio was projected over the medium term using the two scenarios of increased defence spending described above and assuming that the macroeconomic impact of the higher expenditure is that estimated using the MeMo-It model. Either in the scenario with more limited use and in the one with more marked use of flexibility, a structural primary balance increase of 0.5 percentage points per year is assumed for the three-year period 2029-2031, in line with the fiscal adjustment set out in the MTP.
In both scenarios, the primary surplus would decline compared with the pattern set out in the MTP. In 2028, the final year of the clause’s activation, it would stand at 1.8 per cent of GDP in the scenario with limited use of flexibility and 1.1 per cent in the scenario with more marked use of the safeguard clause, thus falling short of the MTP estimates by about 0.1 and 0.8 percentage points of GDP, respectively. In 2041, the primary surplus would converge to 2.2 and 1.2 per cent of GDP, respectively, 0.5 and 1.5 percentage points below the long-term projections of the MTP.
The evolution of the general government net borrowing would reflect these developments. In the scenario with more limited use of flexibility, the deficit would fall permanently below the 3 per cent of GDP threshold in 2027, one year later than envisaged in the MTP approved by the Council. In the second scenario, the deficit would fall below 3 per cent of GDP only in 2030 and, from 2034, would exceed again such a threshold on a permanent basis.
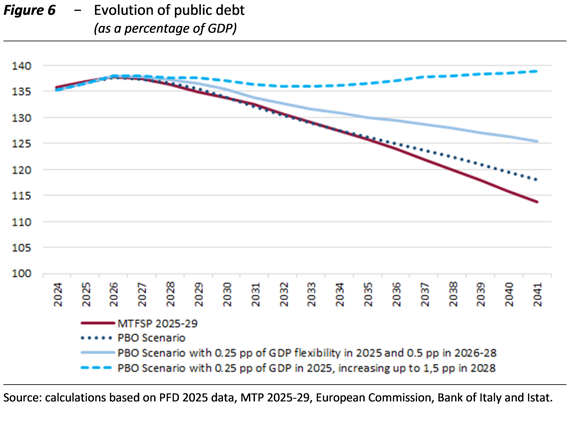
With the activation of the clause, the debt-to-GDP ratio would be higher than in the MTP scenario (Figure 6). In 2028, the debt-to-GDP ratio would stand at 137.3 per cent in the first scenario, up 1 percentage point compared with the MTP, while in the scenario with a larger use of flexibility it would stand at 137.7 per cent. In 2031, the last year of the adjustment period, these levels would rise to 133.9 and 136.3 per cent of GDP, respectively, with deviations from the MTP of 1.4 and 3.8 percentage points.
At the end of the period (2041), in the most prudent scenario, the debt-to-GDP ratio would remain on a downward trajectory, settling at 125.4 per cent. In the scenario with greater use of flexibility, the ratio would continue to increase, reaching 138.9 per cent of GDP, more than 25 points above the corresponding MTP estimate and above the 2024 level.
In the context of the new European economic governance, in order to re-establish a plausible debt reduction path the next MTP will need to outline an adjustment path compatible with the absorption of any deviations that may be eventually required and authorised.
The labour market and productivity after the pandemic
After 2020, labour input measured in terms of hours worked in Italy grew faster than GDP, thanks in part to support measures adopted at national and European level. By contrast, the number of people in employment was little affected by the economic cycle; during the pandemic crisis, the extension of social safety nets such as the Cassa Integrazione (wage supplementation scheme) and the freeze on layoffs limited the decline in employment; in the years following the health crisis, employment increased while hours worked per person employed remained stagnant, thus worsening labour productivity. Total factor productivity (TFP), an indicator of overall efficiency, improved only marginally, reflecting structural problems related to delays in the adoption of technology, work organisation and the institutional environment. In the post-pandemic period, the contribution of TFP was barely sufficient to offset the negative contribution of capital intensity to labour productivity.
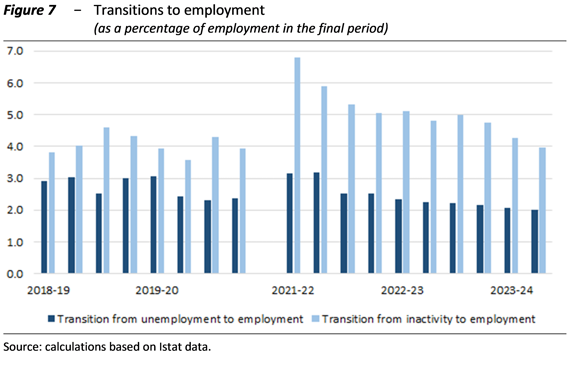
In the post-pandemic period, there was a significant transition of people, especially the inactive, to low-wage employment. After 2020, there were large shifts of people who were not previously looking for work (inactive) into employment; these transitions were greater than those of people who were already looking for work (unemployed), and the gap widened significantly after the pandemic (Figure 7). Real wages fell due to inflation rising faster than nominal wages, while other input costs increased as a result of supply chain disruptions and the energy crisis. The gap between real wage and productivity growth contributed to employment expansion, with elasticity well above unity relative to output.
Women accounted for a large share of new entrants (53 per cent), as did young workers (aged 15-34), exceeding the respective shares of those already in employment (incumbents). In terms of educational attainment, graduates accounted for over 60 per cent of new entrants, but their share was lower than that of people already in employment; on the contrary, the share of secondary school graduates was higher, especially among those coming from inactivity or unemployment. Geographically, new entrants to employment increased significantly in the South, where the share of new employees exceeded that of incumbents by ten percentage points. At the sectoral level, new employment was distributed across the major sectors, with a prevalence over incumbents in the services sector most closely linked to tourism. A prevalence of fixed-term contracts was recorded in some service sectors (commerce, accommodation and transport services, real estate services); a higher share of permanent employment was observed in construction and public administration.
The analysis of labour flows makes it possible to assess the repositioning of workers between companies and sectors. Labour reallocation is considered an important sign of economic dynamism, as it can lead to a shift towards more efficient companies, with favourable effects on aggregate productivity. The excess reallocation indicator represents the part of job creation and destruction not explained by net changes in employment; together with gross reallocation, this measure, constructed on the basis of the number of employees, has tended to decline over the last decade, with a cyclical phase during the pandemic; These less intense movements of human resources between sectors represent a sign of less dynamism for the economy as a whole. At the sectoral level, however, there are mixed trends; the excess reallocation index recovered in trade (in 2021-22) and construction, supported by the significant entry of new firms and therefore new workers.
A closer look at sectoral reallocation in Italian manufacturing shows that productivity gains associated with shifts are delayed and are unlikely to lead to higher wages. In industry, efficiency has also been held back by labour hoarding, i.e. the retention of excess labour relative to current production needs. To examine the adjustment mechanisms within manufacturing in greater detail, a sectoral reallocation indicator based on hours worked was adopted, which captures both employment shifts between sectors and changes in labour intensity. The indicator is strongly linked to the production cycle, as it tends to increase during periods of industrial crisis. Econometric estimates indicate that reallocation shocks may initially generate inefficiencies and mismatches in the labour market, but are favourable to hourly productivity growth in the medium term. However, these gains are not reflected in an acceleration of wage dynamics, which have been severely affected by inflation since the pandemic.
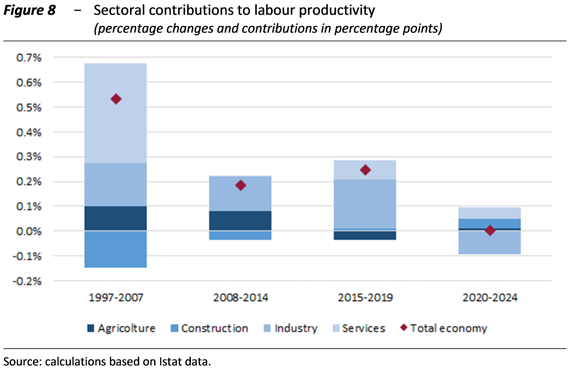
In recent years, labour productivity has been held back by the narrowly defined industrial component. Industrial productivity, which had contributed most to aggregate productivity before the pandemic (Figure 8), was negative in four out of five years between 2020 and 2024, offsetting the modest positive contributions from other sectors. A common factor across all sectors between 2015 and 2024 was the negative contribution of capital intensity. Using shift-share analysis, which breaks down labour productivity into intra-sectoral and inter-sectoral (reallocation) contributions, we find that there was a steady recovery in efficiency within sectors before and after the pandemic, while the reallocation component between sectors clearly slowed productivity from 2020 onwards. This component therefore signals an increase in the labour factor in low-productivity and low-wage sectors.
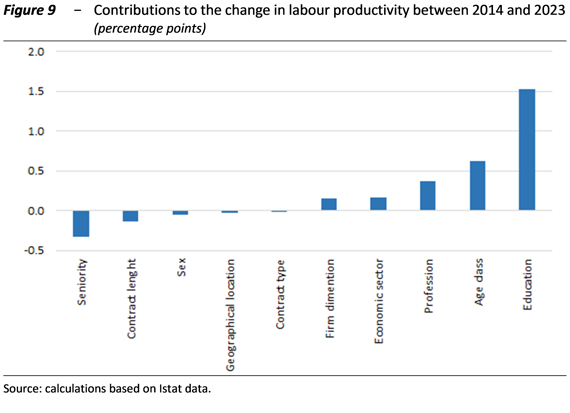
A micro-econometric analysis of the individual characteristics of workers and businesses shows that education plays a key role in explaining productivity trends over the last decade. The approach, based on econometric regressions using individual data, estimates the impact of changes in the composition of the workforce on productivity. Between 2014 and 2023, the workforce saw a significant increase in the share of employees with university or higher education, in the older age groups, in intellectual professions and in large companies, as well as those with fixed-term contracts. Estimates show that these changes in composition accounted for about 2.4 percentage points of the change in productivity over the period considered. Education appears to be the variable that contributed most to the increase in productivity (Figure 9), both because of its strong direct impact and because of the increase in skilled workers. On the contrary, the spread of fixed-term contracts made a negative contribution.
The effectiveness of Industry/Transition 4.0 incentives for businesses
Over the last decade, Italy has made extensive and growing use of tax incentives to guide business investment choices, with a particular focus on digital and technological transformation. There has been a gradual shift – accelerated during the health emergency to speed up the delivery of aid – from deductions, i.e. instruments that reduce the tax base (from 2017 to 2019, increases in depreciation were provided for), to support in the form of offsetable, sometimes transferable and refundable tax credits (starting in 2020). This evolution has led to substantial changes in terms of the accessibility and effectiveness of incentives, given that the two instruments – although both automatic once the conditions for investment are met – have different characteristics. The availability of special depreciation allowance is conditional on the fiscal capacity and, therefore, the profitability of companies, with consequent uncertainties as to the actual possibility of benefiting from it, and the benefit is only realised from the year following the end of the fiscal year (and therefore with a time lag compared to the expenditure due for the investment). Tax credits, on the other hand, are effectively independent of the economic and fiscal situation of the company and their actual usability is almost certain as they can be used to offset any form of tax or contribution, taking on characteristics similar to those of direct subsidies.
The use of tax reliefs increases the uncertainty of public accounts. Compared to direct subsidies, it is more difficult to predict their actual use, which depends on the behavioural reactions of economic agents, leading to greater discrepancies – which may be either in excess or in deficit – between the initial forecasts (appropriations) of revenue losses contained in the technical reports of the individual measures and the actual outcome. Furthermore, the shift from deductions to tax credits has accelerated and increased the potential usability of the concessions, increasing the risks to the sustainability of public finances in the absence of spending caps.
For these reasons, from 2024, quantitative restrictions (spending ceilings) have been introduced for certain tax relief measures, and procedural requirements for their allocation (ex ante controls) and monitoring systems (ex post controls) have been introduced. However, while these allow for greater control of the cost to the public finances, they tend to reduce the advantage for businesses of the (automatic) tax instrument compared to direct subsidies, introducing higher costs of access to the incentives and, above all, significant uncertainty regarding the actual amount of the benefit and its disbursement, thereby weakening the effectiveness of the instrument. Under current legislation, most of the tax reliefs will expire in 2025 and, although the lines of action are not yet clear, it is possible and desirable that the future framework of incentives may differ from that which has characterised recent years, drawing on the experience gained. In this regard, it should be noted that the implementation of the enabling law providing for their redesign and the tax reform law, which provides for new specific incentives only partially implemented in the 2025 budget law, must be completed.
In many respects, therefore, the issue of tax incentives has returned to the centre of the debate in Italy. At a time of major challenges posed by technological and environmental transitions and profound changes in the distribution of value chains, industrial policy should avoid unproductive use of scarce public resources. On the one hand, there is a general question of the allocation of public funds, given that incentives, although intended to serve collective interests, involve a considerable commitment of resources. On the other hand, despite having led to a significant reduction in the cost of capital, fiscal stimulus appears to have been only partially effective: investment in machinery and equipment has remained below pre-financial crisis levels in recent years. Consequently, ex-post assessments of the effects of incentive policies play a decisive role in confirming current policies and/or defining new ones. It is desirable that the design of new incentives be accompanied by elements that facilitate the implementation of such evaluation analyses in order to increase the efficiency and effectiveness of industrial policy.
This chapter contributes to the impact analysis of recent tax relief policies for Industry/Transition 4.0 investments. In particular, after describing the regulations governing these incentives, we analyse their use by corporations, distinguishing between special depreciation allowance and tax credits to highlight their different characteristics, and present the results of a counterfactual analysis to assess their effectiveness in relation to the objectives pursued.
Tax incentives have absorbed significant public resources (approximately €16 billion in the period 2017-2022) and have influenced companies’ investment decisions by reducing the cost of capital – i.e., the minimum return that a company must obtain from an investment to cover all costs, including depreciation and taxes – and by improving their self-financing capacity. The descriptive analysis – which uses the administrative database of tax returns and balance sheet data of non-financial corporations from Bureau van Dijk condensed in the PBO’s MEDITA microsimulation model – shows that in the three-year period 2017-19, 71 per cent of corporations benefiting from the special depreciation went from negative to positive cash flow, compared with 41 per cent of non-subsidised companies. In the period 2020-22, the same phenomenon occurred for 73 per cent of companies benefiting from the tax credit, compared with 53 per cent of non-subsidised companies.
The descriptive analysis also shows that the shift from special depreciation allowances to tax credits has led to significant changes in the composition of beneficiary companies. While the formers were concentrated in the manufacturing sector (around 80 per cent), tax credits were more widespread, with significant growth in the construction sector (from 7-8 per cent to 13 per cent) and in services. There has also been a rebalancing both in terms of geographical distribution, with the share of beneficiary companies in the southern regions growing from 15 to 25 per cent, reducing the previous concentration in the northern regions, and in terms of size, as tax credits have encouraged greater participation by small businesses, while maintaining a concentration of the benefit on medium-sized and large companies. In any case, both types of incentive continued to reward mainly high-performing companies, with profitability indicators and investment dynamics already above average before accessing the incentives.
The counterfactual analysis was conducted on a subset of companies (approximately 79,000 and 92,000 companies for the special depreciation allowance and the tax credit, respectively) in order to compare the beneficiary companies (treated) with a suitable control group of non-beneficiary companies (not treated). The same analysis was also conducted with reference to the growth rate in the number of employees. To this end, a matching strategy was used (in particular, a nearest neighbour matching), identifying another non-treated company with similar characteristics for each beneficiary company. Six distinct cohorts of companies were considered for the estimates, based on the year in which the subsidised investments were made (2017, 2018 and 2019 for the increase in depreciation; 2020, 2021 and 2022 for the tax credit) and the effects were assessed in the year the incentive was introduced and in the following two years.
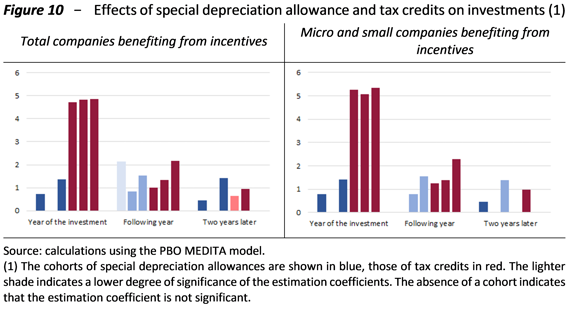
Beneficiary companies recorded higher investment rates, with a more marked effect for tax credits than for special depreciation allowance (Figure 10). Significant effects were also observed in the years following the first, not only due to the design of the measure itself (with the payment of an advance, the relief was extended to investments completed in the following year), but also due to a possible multiplier effect on other investments not directly subsidised and the greater self-financing capacity of companies throughout the period in which the tax benefit, being multi-year in nature, extends.
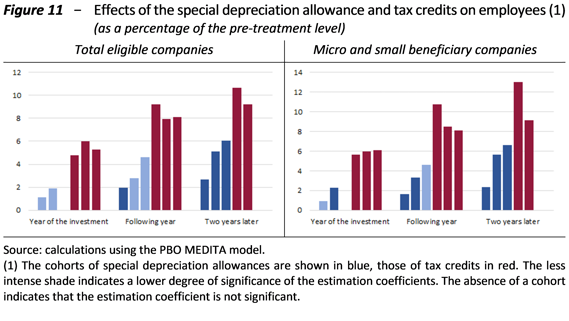
The effects on employment are also positive, with increases in the number of employees that strengthened in the years following the first use of the incentive. Here too, the effect is greater for the tax credit than for the special depreciation allowance (Figure 11).
The analysis also shows that the incentives are more effective for smaller companies and those registered in the South, where the effects appear to have been reinforced by the presence of an additional specific tax credit.