16 March 2023 | The Chair of the Parliamentary Budget Office (PBO), Lilia Cavallari, spoke today at a hearing before the Budget, Treasury and Planning Committee of the Chamber of Deputies as part of the fact-finding inquiry on the macroeconomic and public finance effects of building tax incentives.
Below are summarised a number of the main issues addressed in her speech.
Building bonuses: from temporary measures to direct forms of expenditure. – Building bonuses, initially intended as incentives for renovations, were conceived as temporary measures in the form of deductions from the personal income tax (IRPEF), with a relatively low rate (41 and then 36 percent). Their purpose was to support construction activity and also to encourage the emersion of undeclared work and tax base. Extended and enhanced from year to year, they have also included energy efficiency measures since 2007.
The changes introduced over time have affected every characteristic of the incentives: the period of validity; the rate of deduction; the expenditure ceilings to which the deduction is to be applied; the profile of use, that is, the number of years in which the deduction can be recovered; the range of interventions eligible for the deduction; and, more recently, the modalities of use. As a consequence, they have become considerably more important, both in terms of use and impact on public finance.
Starting from the 2020 Budget Law, measures have been progressively introduced which made some of these deductions equivalent to a direct form of expenditure, with the incentive being raised to a value close to or higher than the total expenditure (90 percent for the Facade Bonus and 110 percent for the Superbonus and Sismabonus) while enhancing the measures for transferability of the tax credit. This has resulted in a significant expansion of the total number of beneficiaries due to both the increased convenience and the inclusion of those with insufficient tax capacity or with liquidity problems, implicitly excluded from the pre-existing incentives.
Incentives before the Superbonus. – From 2008 to 2019, the deductions actually used increased from EUR 2.6 billion to EUR 9.2 billion, of which EUR 7.4 billion for renovations and EUR 1.8 billion for energy efficiency. The information obtained from tax returns makes it possible to derive a distributional profile of the deductions: both benefits are strongly regressive. Half of total deductions are in fact enjoyed by slightly more than 10 percent of the richest taxpayers, who are endowed with real estate assets and high income and who, having sufficient liquidity and tax capacity, can actually afford the expenditure and deduct the deductions from their tax liability. This is further confirmed by the geographical distribution of the deductions: in the period considered, over 60 percent of the deductions were used by taxpayers resident in northern regions.
 The Superbonus 110 initiative and its impact on public finance. – The changes brought about by the launch of the Superbonus incentive and its subsequent amendments led to an important change in the distribution of benefits compared to the original building bonuses. The distribution of the benefits by municipality seems to indicate that the Superbonus had a less regressive impact than the incentives previously provided and was more widely used in the less wealthy areas of the country, particularly in the South, which saw its share of resources more than doubled.
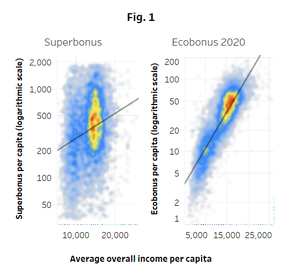
An analysis conducted by PBO reveals a significant change in the composition of the Superbonus beneficiaries compared to the beneficiaries of the original building bonuses. In particular: there has been a significant increase in the use of energy saving benefits in lower income municipalities, an indication of the less regressive nature of the Superbonus (Figure 1); the share of resources allocated to the South of Italy has more than doubled.
Despite this, the geographical distribution shows a higher incidence of recourse to the measure in the North-East of the country, with an average investment per inhabitant of around EUR 1,379, 19 percent higher than the national average (EUR 1,160). This is due to the higher number of people benefiting from the measure (+32 percent compared to the national average) rather than to a higher average investment cost, which is in fact 10 percent lower than the national average.
In terms of effectiveness, work completed by the end of 2022 should result in overall energy savings of at least 307 Kw/sqm on average, according to ENEA estimates. In terms of the number of buildings affected, the target set in the NRRP (to be achieved by 2025) seems to have already been met.
On the other hand, having the entire cost of the measure borne by the State without introducing any selectivity criteria has generated significantly higher expenditure than for previously subsidised energy efficiency improvements.
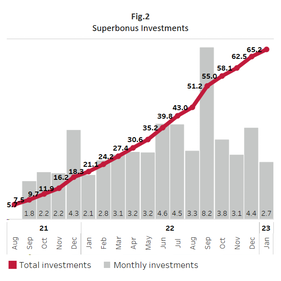 The so-called Ecobonus amounted to approximately EUR 4.5 billion in 2020, while the investments under the Energy Superbonus alone as of January 2023 amounted to EUR 68.5 billion (Figure 2), of which EUR 53.2 billion have been completed. The burden on public finance significantly exceeded initial expectations, which were based on an official expenditure forecast of EUR 35 billion for the entire period of validity of the measure. Combined with the other building bonuses – facade bonus, renovation bonus, etc. – the cost of the benefits is set to exceed even the already revised upwards amount of EUR 110 billion reported in the official forecasts dating back to last autumn’s Update of the Economic and Financial Document (NADEF).
It should also be noted that the change in the criteria for accounting for Superbonus and Facade bonus credits will inevitably lead, other things being equal, to an improvement in the deficit in future years. However, considering that the reclassification has no impact on public debt, the possible use of the resulting fiscal space will imply, other things being equal, a worsening of the projected public debt, jeopardising its reduction trend as planned in the NADEF.
Lastly, the preliminary analysis of the Superbonus incentive suggests the presence of margins to better condition the granting of benefits to those interventions that guarantee the greatest energy savings with equal resources employed, given that the savings estimated by ENEA were largely determined by a minority share of the resources employed (about 70 percent of the savings were achieved with 28 percent of the expenditure). Greater selectivity in terms of beneficiaries would also be desirable. In addition to equity problems, the generosity of the benefits towards the richest taxpayers may be critical in terms of efficiency, since for these taxpayers the “dead weight” (i.e., the investments that would still be carried out even in the absence of the incentive) is plausibly higher.
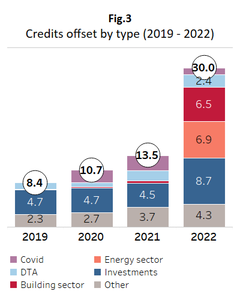 The issue of tax credits. – Building incentives contributed significantly to the increase in tax credits in 2022. The offsetting of all credits (including those for investment incentives, DTAs and emergency measures) increased from EUR 8.4 billion in 2019 to EUR 30 billion in 2022 (of which EUR 6.5 billion related to building; Figure 3). In 2023 and 2024, tax credits can be expected to grow further due to new building investments. With regard to the Superbonus, based on ENEA data, the annual deductions (potential credits) for works completed by 2022 would amount to approximately EUR 12 billion in 2023 (4.8 times the potential credits of 2021); considering also investments not yet completed in 2022 and those approved up to February 2023, provided they can be completed, additional potential credits of up to EUR 6 billion per year could be generated in 2024.
The offsetting data for the first two months of 2023 (Figure 4) show a clear increase in tax credits related to building compared to the corresponding period of the previous year: the Superbonus credits increased by 2.8 times, facade credits by 2.4 times, while relatively smaller, albeit significant, increases were observed for the Ecobonus (+46 percent) and other building credits (+63 percent). In addition, there was a significant reduction in the share of credits offset by banks and postal services (from 79.9 percent to 57.1 percent) to the benefit of construction and building sector companies (from 8.8 to 17.1 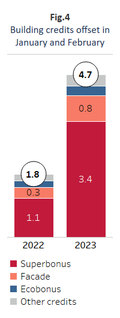 percent), of other companies in the financial and real estate sector (from 8.2 to 11.6 percent) and, above all, of companies in other sectors not directly involved in construction and not belonging to the financial system (from 3 to 14.1 percent). This could be a sign of the increasing difficulty for companies to transfer credits. By removing the possibility of benefiting from building incentives through an invoice discount and the transfer of the tax credit to third parties, the provisions contained in Decree-Law 11/2023 put an end to the accumulation of new credits, except for those who had already fulfilled certain documentary obligations at the date of entry into force of the measure. This may significantly limit the use of the incentives.
The Superbonus and its macroeconomic effects. – The deployment of such huge resources has had significant macroeconomic effects: the construction sector grew considerably in 2021-22, more than in other European countries. However, it should be noted that construction was driven not only by the residential sector, but also by the non-residential sector and by public works. In addition, looking at the annual evolution, investments in houses were very high in 2021, when the use of the Superbonus was low, while it definitely slowed down in 2022, when the incentive was much more used.
According to the most recent national accounts data, which may be revised in the coming quarters, the contribution of investments in residential construction to GDP growth in the past two years amounted to two percentage points. On the basis of the macro-econometric model used by the PBO, it is possible to deduce that half of the contribution is attributable to the positive shock generated by the tax incentive, that is, the additional investment in housing compared to the one that would have been made in any case during the two-year period without the tax incentive (the so-called counterfactual scenario). Since this is a shock affecting the individual sector, without taking into account its repercussions on the rest of the system (thus without considering the effects on the other components of aggregate demand), this measure is not to be interpreted as a multiplier. Intersectoral tables can be used to quantify the supply-side effects on the other sectors; it should be noted that an expenditure shock in the construction sector propagates to the rest of the economy (direct and indirect channels) resulting in a value added that at equilibrium is approximately similar to the initial shock, i.e., with a multiplier close to unity.
A complete analysis of the impact of the incentive on the Italian economy, also including the positive effect on public budget revenues, is however difficult to carry out using only macroeconomic instruments, all the more so in a period characterised by exceptional shocks (the pandemic and the war in Ukraine) which have affected the various in an asymmetric manner. Stronger evidence could be obtained by supplementing the analysis with microeconomic data on both the beneficiary households and the companies that carried out the construction work, which is currently unavailable.